

What is Volume Profile Range Indicator?
The Volume Profile Indicator for MT5 helps traders see exactly where the market has traded the most. Instead of showing volume by time, it displays volume by price levels on the side of the chart, making it easy to spot strong support and resistance zones. This clear visual view of trading activity helps you understand market behavior and make better trading decisions.
Volume Profile Range Indicator Strategies
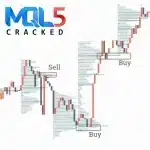
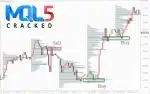
The Volume Profile Range Indicator helps traders spot strong support and resistance by showing where the most trading activity happened. The key level to watch is the VPOC/POC, which often acts as a reversal point. When price retests this area, it can offer clean entry or exit opportunities.
Price also moves quickly through low-volume areas, making them useful for trend-continuation setups. High-volume zones, on the other hand, are good areas for taking profits or tightening stops.
By combining these volume levels with basic price action, traders can easily spot reversals, breakouts, and continuation trades on any timeframe.


Key Features of Volume Profile Range Indicator
The Volume Profile Indicator uses tick volume from the smallest available timeframe to build a clear horizontal volume profile. This lets traders see exactly where trading activity is most concentrated at different price levels.
You can choose any custom period, from 1 minute up to 1 month, to create the volume histogram. The indicator also offers several display styles, including horizontal lines, empty or filled bars, outlines, and colored blocks, so traders can view the data in the format they prefer.
It also includes helpful metrics such as:
- VPOC (Volume Point of Control): Shows the price level with the highest trading activity. Multiple VPOCs can appear within the same range.
- Max VPOC: Marks the strongest VPOC within the selected period.
- Median Volume: Shows the midpoint of all volume levels, giving a balanced view of activity.
- VWAP: Calculates the average price weighted by volume, helping traders understand the true market value.
Together, these features make the indicator flexible, informative, and easy to adapt to any trading style.
How Volume Profile Range Indicator Works (Strategy Breakdown)
The Volume Profile Range Indicator builds a detailed picture of where trading activity is happening within a selected price range. It uses tick volume or real volume (if your broker provides it) to calculate how much trading took place at each price level. This information is then displayed as a horizontal histogram directly on your chart.
- Choosing the Volume Source
You can select between:
- Tick volume, taken directly from your broker’s server
- Interpolated data from M1, M5, or M15 candles, when live tick data isn’t available
This flexibility ensures the indicator works on any chart.
- Setting the Range
You can define exactly how the profile is built by choosing:
- A custom period (1 minute to 1 month)
- The last “X” minutes
- A manual range using two movable lines
This lets you focus on specific sessions, trading days, or custom zones.
- Visualizing the Volume
The profile can be displayed in different styles such as lines, empty bars, filled bars, outlines, or colored blocks. You can also choose where the histogram appears—left, right, inside the range, or outside it—making the chart clean and easy to read.
- Identifying Key Levels
The indicator highlights important volume-based zones:
- VPOC/POC – the price at which the most volume was traded
- Max VPOC – the strongest VPOC across multiple periods
- Median Volume – the midpoint of volume distribution
- VWAP – the average traded price weighted by volume
These levels help identify potential reversals, support and resistance, and trend strength.
- Fine-Tuning the Profile
You can control how detailed the histogram is by adjusting:
- Point scale (affects display smoothness vs. speed)
- Step size for modes (helps with clearer peaks)
- Line width and colors for better visibility
These settings help traders tailor the indicator to any instrument – forex, stocks, futures, or crypto
- Strategy Application
Once the profile is built, traders use it to:
- Spot strong support/resistance at VPOC
- Find fast-moving zones through low-volume areas
- Identify high-volume clusters for profit targets
- Confirm entries with VWAP and price action
By breaking down where the market traded most, the indicator reveals a hidden structure that isn’t visible with regular candles alone.
Top 4 Alternatives
Download Volume Profile Range Indicator Free (VIP Members Only)
👉 Become a VIP Member & Download Volume Profile Range Indicator free
(VIP link here)
FAQ
Is this indicator suitable for beginners?
Yes. The Volume Profile Range Indicator is beginner-friendly thanks to its clear visuals, such as colored volume bars, VPOC levels, and easy-to-read histograms. For best results, simply pair it with basic price action analysis.
Can I use this indicator with any MT4 broker?
Definitely. The indicator works smoothly on all standard MT4 brokers.
For stronger volume accuracy, lower spreads, and better execution, we recommend using reputable forex brokers that support stable tick data.
Does the indicator repaint?
No. The Volume Profile Range Indicator is non-repainting. Once the profile is generated for a selected range or timeframe, the displayed volume data remains fixed and reliable.
Can it be used for Gold, Crypto, Indices, and Stocks?
Yes. This indicator works across all major markets, including XAUUSD (Gold), cryptocurrencies, indices, forex pairs, and stocks, as long as volume data is available. It’s extremely versatile and perfect for multi-asset traders.
Is there an MT5 version available?
Yes, we also provide a fully optimized MT5 version of the Volume Profile Indicator. It includes the same core tools, VPOC, VWAP, high-volume node,s plus additional improvements that take advantage of MT5’s faster system and better volume handling.


Reviews
Clear filtersThere are no reviews yet.